Yes, this is certainly an option!
Just give a create a different Assessment Set to indicate each one. For example, if the child’s school is subscribed to the ROCC, then the teacher would use the Assessment Set that is being used for their school for that period “Term 1, 2021”. This will ensure that the teachers assessment will be included in the whole school data that is based around that Assessment Set.
Then the speech pathologist and parent could score with a different Assessment Set that will show up in the Participant Assessment Graph. You could name them something like “Term 1, 2021 speech pathologist” and “Term 1, 2021 parent”.
This would then allow a graph to be generated for each of the three assessments, and the results compared and discussed between the speech pathologist, parent and teacher. This could provide interesting insights and discussion points between all three.
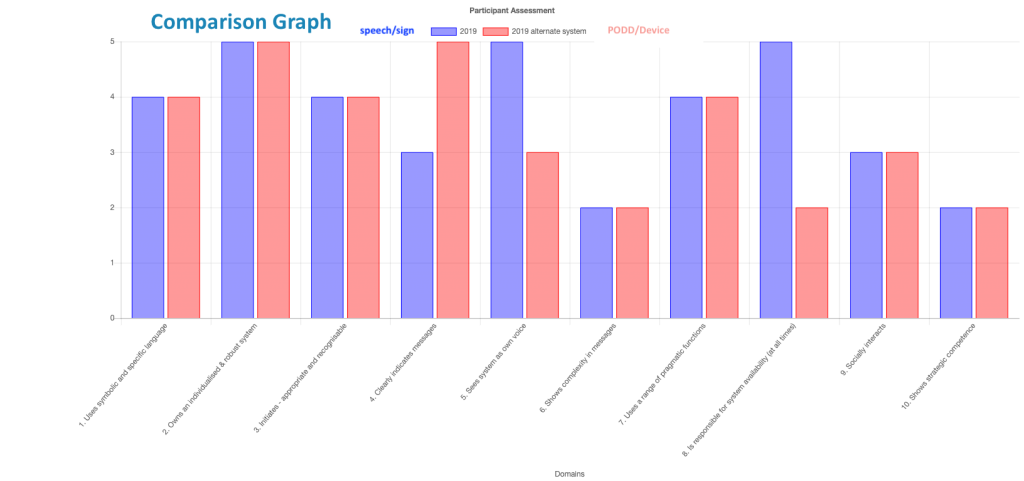
Here is an example of a comparison graph used to compare different systems. For different ‘informants’ you would use a similar process.

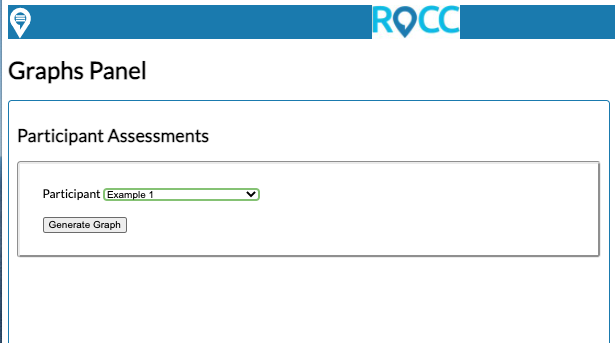
You can access this graph via the Graphs panel. Select the participant, then generate the graph.

At the top of the graph, click on the coloured box for the Assessment sets that you want to show or not show in your graph.

Then select the ‘Save graph as image’ button in the bottom right corner.

The “Help” file available with your subscription will provide you with more information on Assessment Sets and Graphs.
